Updates every 60 seconds
Every Metric. Every Agent. Every Contact. Right Now.
Dashboards that update every 60 seconds. Complete visibility into queues, agents, and contacts—all in one view.
Start Your Free Trial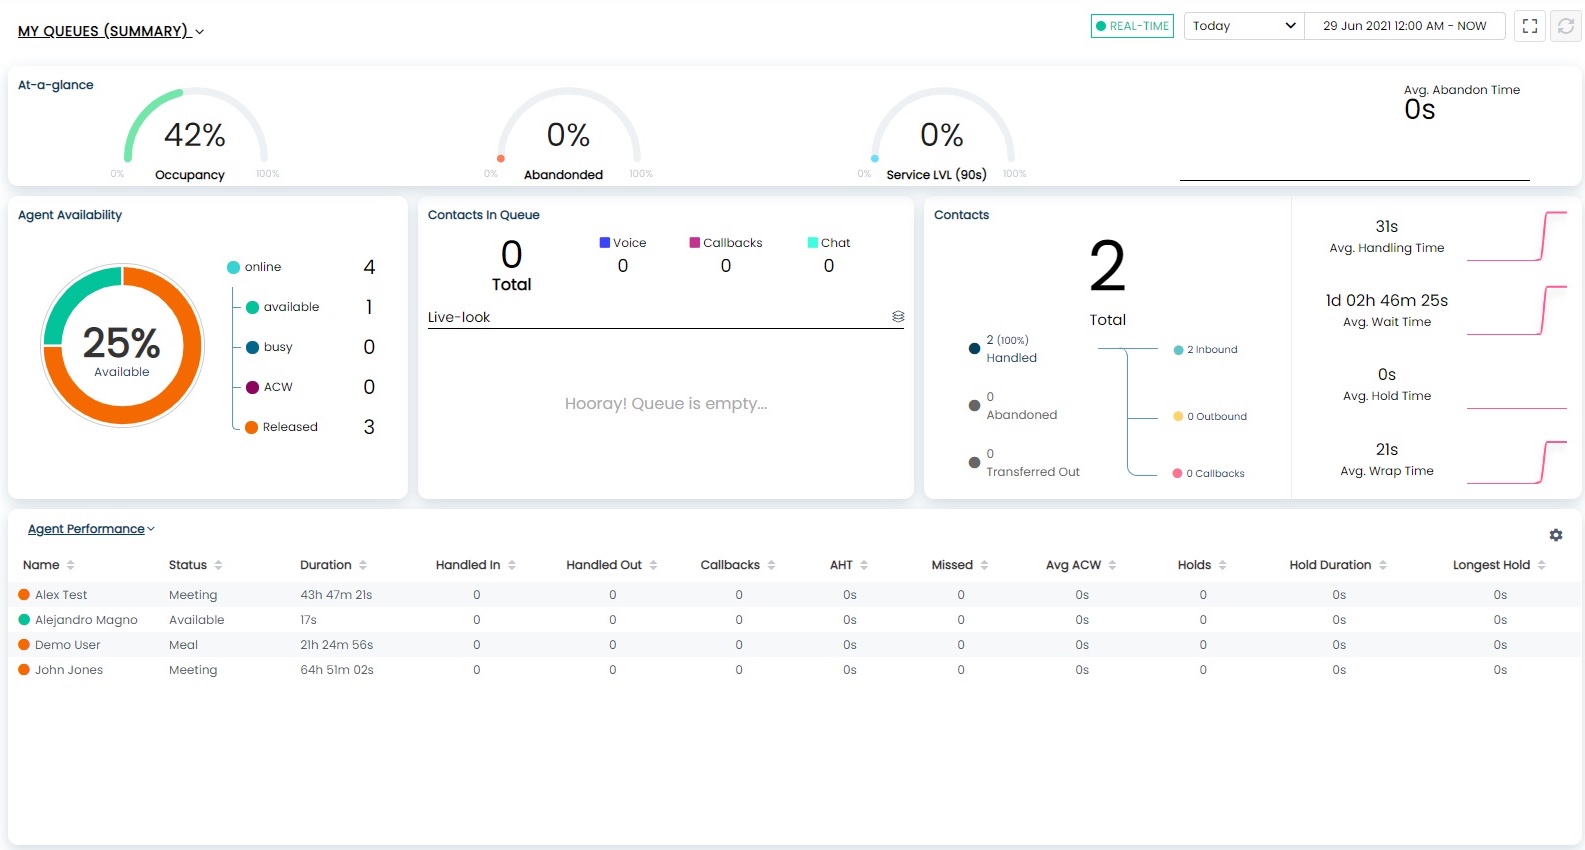
Home Dashboard
At-a-glance widgets with occupancy, abandoned %, service level, and average abandon time. Agent availability chart by status and contacts time series throughout the day.
- At-a-glance widgets: Occupancy, Abandoned %, Service Level, Avg Abandon Time
- Agent availability chart by status (Available, Busy, ACW, Released)
- Contacts time series throughout the day
- Agent and Queue performance tables with customizable columns

LiveLook
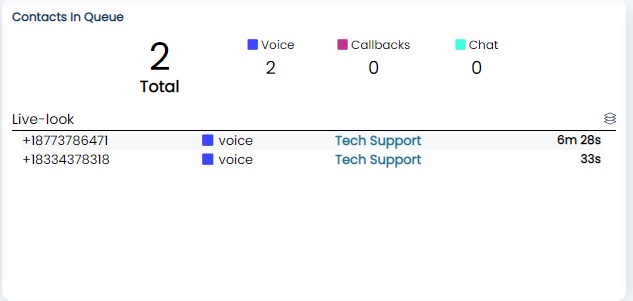
See individual contacts waiting in queue—not just aggregate counts. Caller ID, time waiting, queue name, and custom contact attributes from flows.
- See individual contacts waiting in queue (not just aggregate counts)
- Caller ID, time waiting, queue name
- Custom contact attributes from flows
- Click to view contact details
Wallboard Mode
One-click fullscreen display designed for floor monitors and TV displays. No additional configuration required.
- One-click fullscreen display
- Designed for floor monitors and TV displays
- Auto-refresh without user interaction
- No additional configuration required
Custom SLA Targets
Configure up to 10 SLA targets with visual indicators when SLAs are at risk. Service level tracking by queue.
- Up to 10 configurable SLA targets
- Visual indicators when SLAs are at risk
- Service level tracking by queue
- Real-time threshold alerts
Related Supervisor Tools
Start Your Free Trial
Deploy ConnectPath in less than 15 minutes and give your supervisors real-time visibility today.
Get Started